How do you graph #f(x) = 4^x + 2# by plotting points?
2 Answers

Work out some points and plot them.
Choose
Explanation:
You do it in exactly the way that the question asks... plot points.
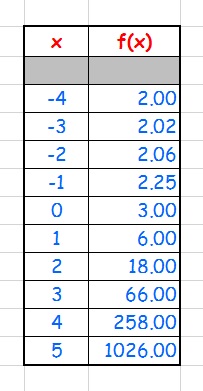
To find the points which you need to plot, draw a table and choose about
Now use each of your
Now draw a set of axes and plot the points. The last one will probably not fit, but you have an idea where it will lie.
Draw the graph by joining the points. You will see that it is an exponential graph. graph{y= 4^x+2 [-7.785, 3.465, 0.405, 6.03]}

Please read the explanation.
Explanation:
Exponential Functions have a fixed number as the base and a variable as its exponent.
Let us also write its Parent Function.
A parent function is the simplest form of the given function.
Let us say
We do this because we can examine the graphs of both the functions to understand the behavior of the given function.
Next, consider the given function.
Create a table of values for this function as shown:
Let us now analyze the graphs of the given function and its parent function:
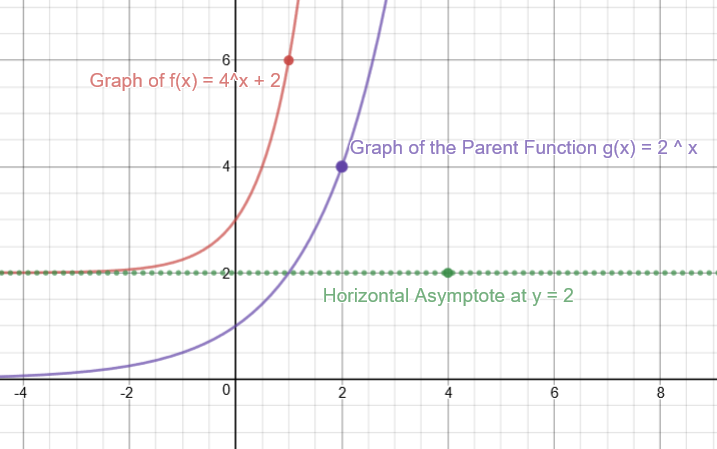
Observe the following:
(1)
(2) If the coefficient of the x-term increases, then the graph leans sharper towards the y-axis.
(3) For any value of
(4) For the parent function
(5) For the given function
(6) Exponential growth is bigger and faster than the growth of a polynomial.
(7) As values for
Hope you find this solution useful.
